Tech. Science. Politics. Now.
News
Commentary
Technology
Science
Politics
Cartoons
Infographics
Tag - infographic
Where is Cannabis Legal in the USA?
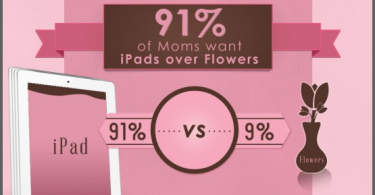
How to Choose the Right Gift That Matches Your Brand
Weight Loss Isn’t What You Think
Water is Life [Infographic]
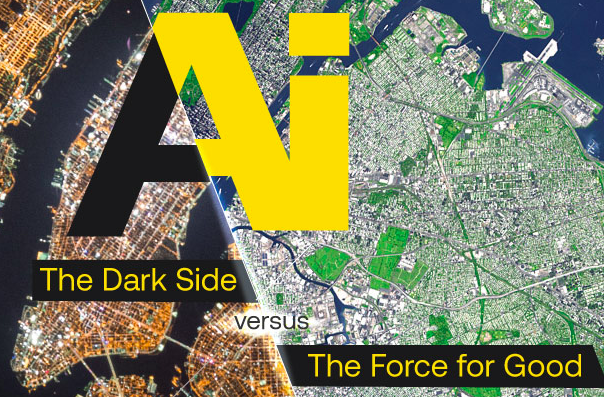
INFOGRAPHIC: AI for Good VS AI for EVIL
INFOGRAPHIC: These Cheap Tech Fixes Will Transform Life in Developing Countries
INFOGRAPHIC: Does Cyber Crime Make The Internet Stronger?
Daily Infographic: The Surprisingly Long History of E-Sports Betting
Burning Unicorns in Silicon Valley
Halloween in the U.S. is Big Business [infographic]
Compact Living: Size Does Matter [infographic]
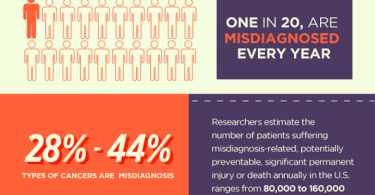
Five Percent of US Doctor Visits End in Misdiagnosis [infographic]
The World’s Nastiest Startup Power Struggles [infographic]
Don’t US Kids Deserve The Right To Be Forgotten? [infographic]
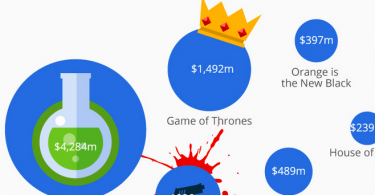
How TV Producers Lose Billions to Piracy [infographic]
CEO Pay: US Bosses Earn 400 Times More Than Workers [infographic]
Wasting Time? Top 10 Time Killers Infographic
Hands-Free Calling: Here’s Why You Can’t Handle It [infographic]
Can I Use This Picture flowchart
Charleston Church Shooter: Racism Infographic
Body Language as A Business Tool [infographic]
Tech Philanthropy: To Give or Not to Give [infographic]
Top 150 Secret Destinations [infographic]
Getting A Ph.D.? You’re in for The Long Haul [infographic]
Online Education in the Developing World [infographic]
On The Wisdom of Job Jumping [infographic]
Should You Text Him? Check Out This Flowchart First
How to Brew That Perfect Cup of Coffee [infographic]
Matching The Beer to The Beer Glass [infographic]
Solstice 2013: Ultimate Summer Solstice Infographic
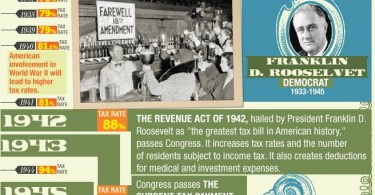
Tax Day, Emancipation Day: What Abraham Lincoln Had to Do With It
NCAA March Madness 2013: Infographic, Live Stream, Stats, Apps
Spring Has Sprung: Why Tilt Matters, Vernal Equinox infographic
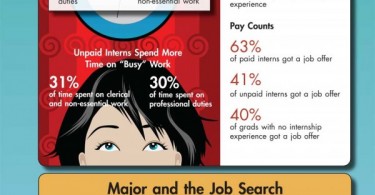
The Job Search for the Class of 2012 (infographic)
SXSW 2013 Infographic Ultimatus: Everything You Ever Wanted To Know Re the Show
Mother’s Day Infographic: Mom Wants Tech over Tulips
Android versus Apple iOS Compared: 2012, 2013 Sales, Infographic
Super Bowl 2013 Ads Cost More than Linebacker?
2012 in Review Infographic: The Tech Year in Living Color
Countdown: Three Days to the End of the World Infographic
Middle Earth Map, The Hobbit and JRR Tolkien infographic
Has Apple Peaked? What’s Next for Apple infographic
I Saw Mommy Googling Santa Claus: 2012 Online Shopping Trends
Thanksgiving Infographic: By the Numbers
U.S. Presidential Election 2012: Logistics of Voting Infographic
Money Infographic: All of It, Where It Is, What It Can Do
Step Away from the Facebook Cyberstalking Infographic
World Series 2012 infographic, San Francisco Giants Nail Detroit Tigers, Swept Series
The History of Microsoft Windows Infographic
How the Internet Works infographic
How Social Media Scores Get You a Job infographic
Email Hour by Hour Infographic: The Best Time to Send Email
Infographic: The Health Hazards of Tablet Use
Use It or Lose It: Death of Daily Deals Infographic
Smartphones in China: Apple iOS vs. Google Android infographic
Enemies of the Internet infographic
National Coffee Day Infographic: Who Needs Coffee Most?
Autumnal Equinox infographic
BYOD Infographic: the Good, the Bad and the Ugly
To Post or Not to Post Infographic: Should I Post This?
Driverless Cars, Green, Fiber: Google Casts a Wide Net infographic
Star Wars vs. Star Trek infographic: Technological Superiority Goes To …
Labor Day 2012 Infographic: Labor By Nation, in Living Color
Evolution of the Geek infographic
Facebook Timeline: How To Optimize It for Your Business
Patent Lawsuits Infographic: Call Them Apple Tech Wars
Geek or Hipster? Know Thyself, infographic
Steve Jobs: Late Apple CEO Retired One Year Ago infographic
The Age of Apps Infographic: the World of Apps Going Forward
Windows 8: RTM Version Out, Infographic
Olympics 2012: Projected Results vs. Reality
Going the Distance: Online Education Infographic
Infographic: Bring Back the Forty Hour Work Week
Smartphone Jerks: You Can Do Better
Happy Fourth of July infographic
Pinterest Tips, Tricks and What 11.7M Users Are Doing There (infographic)
Can Social Media Activity Boost Organic Search Ranking? (infographic)
Memorial Day 2012: IBM Knows What You’re Doing This Weekend (infographic)
The Worst and Best Apps in the World (infographic)
SpaceX Dragon: How Does It Work, In-Depth (amazing infographic)
Mother’s Day 2014: Not Yo Mama’s Mama
The Ultimate Friday the 13th Infographic
Apple April 1 Anniversary: History of Apple (est. April 1 1976)
Tech Travelers: How Not To Be An Ugly American Geek
Geek or Nerd: You Decide