Tech. Science. Politics. Now.
News
Commentary
Technology
Science
Politics
Cartoons
Infographics
Tag - Infographics
The Cost of a Championship: Super Bowl 2015 [infographic]
Knot 2 Shabby: How To Secure Anything [infographic]
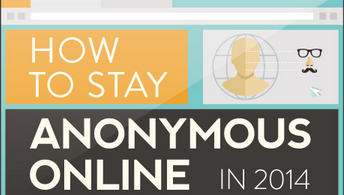
How To Stay Anonymous Online: Best Tools for 2014
Google Car: What It’s Made Of, How It Works
Telstar I Anniversary: History of Satellites [infographic]
Peer Pressure [infographic]
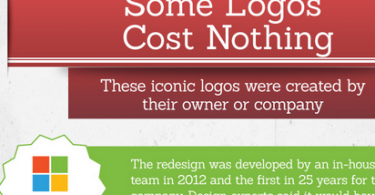
John C. Dvorak: On Color, Value and the Evolution of Logos [infographic]
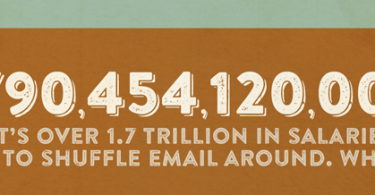
Whoa, Bessie: The Staggering Cost of Business Email [infographic]
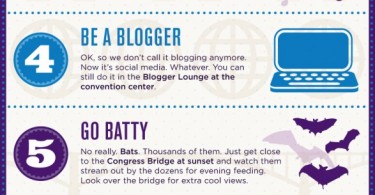
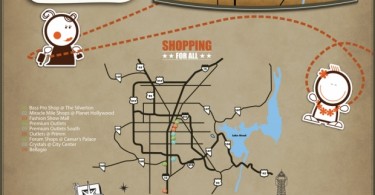
SXSW 2014: Things to Do in Austin You Never Thought of
Snooping 101: Fourteen Ways to Get the Goods on Anyone
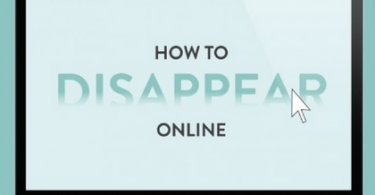
How to Disappear Online (tips, infographic)
CRAZY! World’s Top 10 Fastest Supercomputers (infographic)
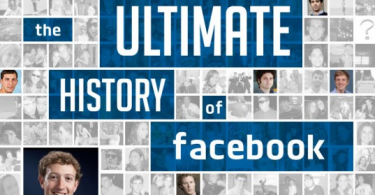
Facebook at 10 Years: Ultimate History of Facebook infographic
Password Crazy: Beginner’s Guide to Thwarting Hackers infographic
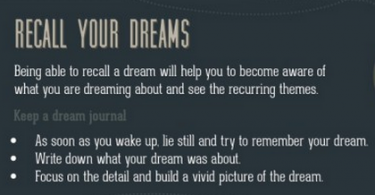
How to Control Your Dreams (infographic)
Eleven Untranslatable Words infographic
Matching Movies to Turkey Size: Thanksgiving Day Netflix Playlist (infographic)
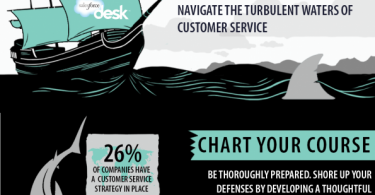
Customer Service: Top 10 Survival Skills You Need to Survive the Sharks (infographic)
Shark Week 2013: A Tale of Tails, Fins, Shark Attack Infographic
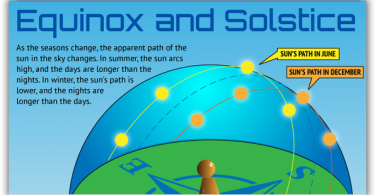
Solstice 2013: Ultimate Summer Solstice Infographic
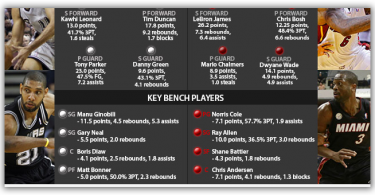
NBA Finals 2013: San Antonio Spurs vs. Miami Heat infographic, Heat Wins Game 6 in OT
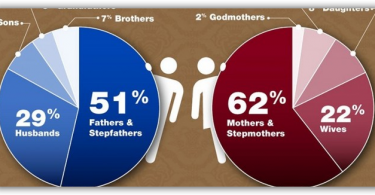
Father’s Day vs. Mother’s Day Infographic: Bummer for Daddy-o?
Why, When and How a Tornado Forms: Infographic
Google I/O 2013: Things to Do in San Francisco
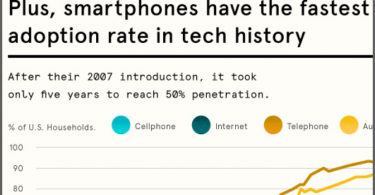
When Millions are Minions: Mobile Empire infographic
Born with a Four-Inch Pompadour? Best Guitar Sites and How You Rock
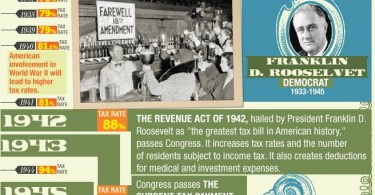
Tax Day, Emancipation Day: What Abraham Lincoln Had to Do With It
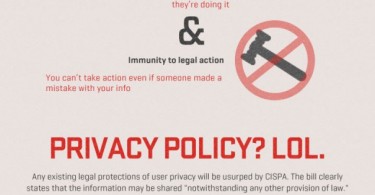
Why Obama Would Veto CISPA 2013: House Passes It, News, Infographic, Analysis
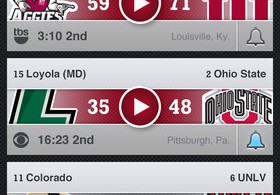
NCAA March Madness 2013: Infographic, Live Stream, Stats, Apps
Why Four Digit PINs Blow: How to Protect Your Data infographic
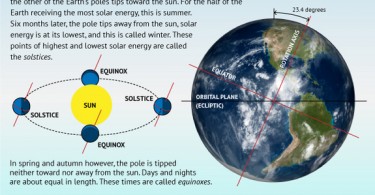
Spring Has Sprung: Why Tilt Matters, Vernal Equinox infographic
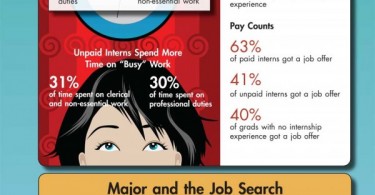
The Job Search for the Class of 2012 (infographic)
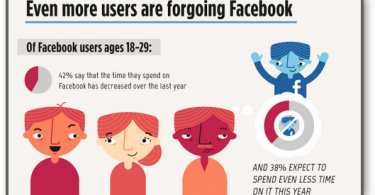
Hate Facebook? Call It Facebook Fatigue infographic
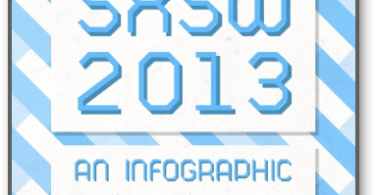
SXSW 2013 Infographic Ultimatus: Everything You Ever Wanted To Know Re the Show
SXSW 2013: 10 Things to Do While You’re in Austin
RSA 2013: History of Encryption Through the Ages, From 700 BC Scytale to DES to Now, Wow
RSA 2013: Day One, Conference Social Schedule, Big Data Infographic
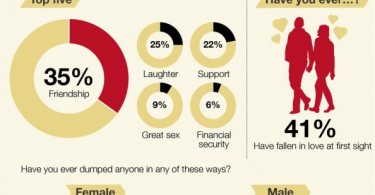
Valentines Day 2013 Infographic: Breaking Up via SMS
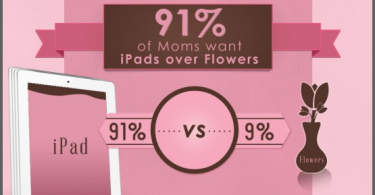
Mother’s Day Infographic: Mom Wants Tech over Tulips
Android versus Apple iOS Compared: 2012, 2013 Sales, Infographic
Super Bowl 2013 Ads Cost More than Linebacker?
Flu 2013 Infographic, Influenza Facts Gone Viral, Engineers Immune (parody video)
CES 2013: 101 Things to Do in Las Vegas infographic
2012 in Review Infographic: The Tech Year in Living Color
Countdown: One Day Until the End of the World infographic
Countdown: Three Days to the End of the World Infographic
Countdown: Four Days to the End of the World infographic
Countdown: Five Days to the End of the World infographic
Middle Earth Map, The Hobbit and JRR Tolkien infographic
I Saw Mommy Googling Santa Claus: 2012 Online Shopping Trends
Black Friday Infographic: Share Your Horror Stories (open4readers)
Thanksgiving Infographic: By the Numbers
Exoplanet Super Earth Infographic, Major Discovery: Carl Sagan Was Right
U.S. Presidential Election 2012: Logistics of Voting Infographic
U.S. Presidential Election, Social Media Election infographic
Money Infographic: All of It, Where It Is, What It Can Do
Dr. Who infographic, fiftieth anniversary 2013 plans
Day of the Dead 2012: Zombie Venn Diagrams
Step Away from the Facebook Cyberstalking Infographic
The History of Microsoft Windows Infographic
How the Internet Works infographic
How Social Media Scores Get You a Job infographic
Email Hour by Hour Infographic: The Best Time to Send Email
Infographic: The Health Hazards of Tablet Use
Use It or Lose It: Death of Daily Deals Infographic
Smartphones in China: Apple iOS vs. Google Android infographic
Enemies of the Internet infographic
National Coffee Day Infographic: Who Needs Coffee Most?
Autumnal Equinox infographic
BYOD Infographic: the Good, the Bad and the Ugly
To Post or Not to Post Infographic: Should I Post This?
Star Wars vs. Star Trek infographic: Technological Superiority Goes To …
Labor Day 2012 Infographic: Labor By Nation, in Living Color
Evolution of the Geek infographic
Crowdsourcing AIDS, Politics: Power to the Online People infographic
IFA 2012: What to Do in Berlin infographic
Facebook Timeline: How To Optimize It for Your Business
Patent Lawsuits Infographic: Call Them Apple Tech Wars
Geek or Hipster? Know Thyself, infographic
Steve Jobs: Late Apple CEO Retired One Year Ago infographic
The Age of Apps Infographic: the World of Apps Going Forward
Windows 8: RTM Version Out, Infographic
Going the Distance: Online Education Infographic
Mars Landing 2012 Infographic: How Mars Rover Curiosity Works
Christmas in July: Digital Music Sales Neither Joyful Nor Triumphant
Olympics 2012: The Twitter Games at the Socialympics (infographic)
How it Works: Fiber Optic Infographic
Infographic: All 786 Known Planets Drawn to Scale
Summer Olympics 2012 London: All the Stats In Living Color
Infographic: Bring Back the Forty Hour Work Week
Infographic: 13 Terrible Things That Happened on Friday the 13th
Smartphone Jerks: You Can Do Better
Happy Fourth of July infographic
Amelia Earhart Infographic: 75 Years Since She Disappeared
Pinterest Tips, Tricks and What 11.7M Users Are Doing There (infographic)
Can Social Media Activity Boost Organic Search Ranking? (infographic)
WWDC 2012: 47 Things to Do in San Francisco While You’re In Town (infographic)
Transit of Venus 2012: (infographic, explainer, video, viewing details)
History of Windows Infographic
Golden Gate Bridge 2012 Infographic: History in Numbers and Pictures
Memorial Day 2012: IBM Knows What You’re Doing This Weekend (infographic)
The Worst and Best Apps in the World (infographic)
SpaceX Dragon Closes in on International Space Station (video)
SpaceX Dragon: How Does It Work, In-Depth (amazing infographic)
Social Media Marketing: Only for the Brave (INSANE Infographic)
Facebook: By The Numbers, How It Looks Post IPO (infographic)
Facebook IPO, Analysis, Details, Numbers: Infographic
Solar Eclipse May 2012: One Mega Ring of Fire (infographic)
Mother’s Day 2012: Mom Wants Tech (infographic)
Mother’s Day 2014: Not Yo Mama’s Mama
Perigee Moon 2012: Full Moon Plus Close Orbit Means Supermoon (infographic)
Samsung Galaxy SIII: 53 Percent Android Developers Own Samsung Smartphones (infographic)
How Apple iOS, Windows Phone 7.5 and Android 4.0 Ice Cream Sandwich Compare (infographic)
Windows Phone 7 (infographic)
Asteroid Mining: How It Works (Infographic)
Earth Day 2012 Infographic: Is the Internet Killing the Planet?
Earth Day 2012: The Secret Life of Garbage (infographic)
CISPA: What Is It and How Is It Like SOPA? (infographic)
The Ultimate Friday the 13th Infographic
R.M.S Titanic: Early Infographic, Circa 1912
Instagram: Its History and Meteoric Rise to the Facebook $1 Billion Acquisition (infographic)
Easter Bunny Infographic: Chocolate Stats to Make You Joyous, Sick or Hungry
Jeff Bezos: Recovering Apollo 11 Saturn V Rocket Engines (infographic)
Apple iPad versus Textbooks by the Numbers (infographic)
Google Android and Apple iOS: The Maturation (infographic)
April Fools’ Day 2012: Stats, Tricks and April 1 Tech Pranks
Apple April 1 Anniversary: History of Apple (est. April 1 1976)
How Patent Wars Stifle Innovation (infographic)
Spring has Sprung: Vernal Equinox Infographic, TILT!
Happy St. Patrick’s Day 2013: Everything You Ever Wanted To Know (infographic)
Kill This Infographic (infographic)
Site Security: Tougher Than You Think
Apple iPad 3 HD Near Retina Display (infographic)
Windows 8 Consumer Preview: Top 10 Features (infographic)
SXSW 2012: Ten Things To Do in Austin While You’re There (mediatapper)
Facebook, Twitter, Google+, Pinterest? Make Your Biz a Social Media Machine (infographic)
Sixty Seconds of Social Media (infographic)
Social Media Privacy: Trust No One (infographic)
Create Compelling Content: 22 Ways To Do It (infographic)
Shutterstock: Global Design Trends (infographic)
And the Best Host for Your Website Is …
Google+ : Guys, Gals and a Gang of Geeks from Bangalore
Google Juice: Google, Disney, Apple Lead Top 20 Social Brand Lineup
The Anatomy of a Great Website: Infographic
Hotels.com: Romance Survey
The Psychology of Color (infographic)
Social Media Fail: How To Deal
Google: The Whole History
Geek or Nerd: You Decide
New Google Doodles: Easy Browsing UI and a New Google Doodle Store, Too?
Android: Facebook Rules Android App Use, Rated Most Popular (Nielsen)
Real Life Minority Report: Predicting Crimes Before They Happen (infographic)
Mozilla Firefox Security Issues: Google-Sponsored Study Questions Firefox Security (Forbes)
Lean-in vs. Lean-back (NYT)
Can Facebook Get You a Job?
Smartphone College Habit: How Bad Is It?