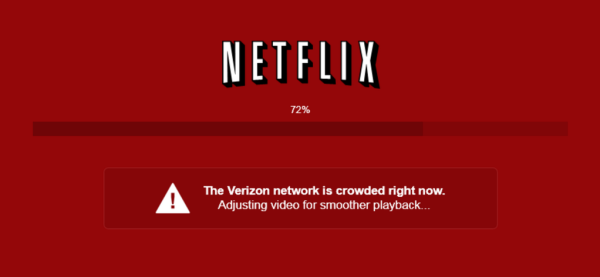
aNewDomain.net — Netflix recently displayed a buffering message that intimated Verizon. The message was that Verizon’s FiOS network was “crowded” (image below). It’s a very tangible moment in the data-streaming battlefield, where ISPs and content providers continue to haggle and hack at each other, all at the expense of the consumer.
We need more data and less accusations.
Netflix, in the case below, blames Verizon for adjusting bit-rate:

Image Credit: Larry Press
Verizon lashed back. It claimed the upstream from FiOS was congested, and Verizon threatened with legal action. Netflix dropped the notice for now.
Data Transparency
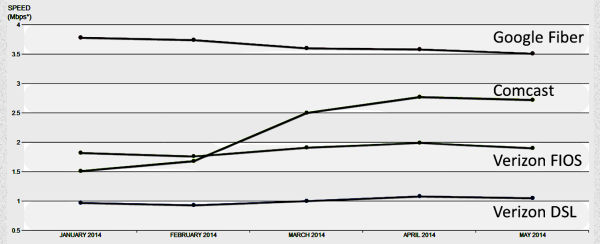
Even as the companies blame each other and battle it out, regulators and the public need legitimate data transparency. Below are data-rate histories provided by Netflix for Comcast, Google Fiber, Verizon DSL and FiOS:

Image Credit: Larry Press
In February Netflix and Comcast signed a deal that would increase the speed of traffic — the data above proves this is working. While the increase in speed is good, the details of that improvement were not publicized. For instance, how much investment was required, and how did Netflix manage other ISPs?
Verizon DSL ranks lowest due to the technology, and while FiOS customers have much faster speeds, it doesn’t outpace Comcast or Google fiber. Yet FiOS is the Verizon fiber network. How does this work?
Google publishes YouTube streaming data based on your ISP. The data for my not-so friendly ISP, Time Warner Cable, is shown below for Los Angeles, my city.
The graph details YouTube video consumption for a 24-hour period. The consumption peaks at 9 p.m.

Image Credit: Larry Press
Google also shows what percentage of time an ISP delivers 720p (HD) content, 360 (SD) and lower quality. The worst times for me are between 9-10 p.m., which is HD 81 percent and SD 19 percent of the time. This varies based on your ISP and location, of course, but the statistics are nice to have.

Image Credit: Larry Press
Through YouTube, Google helpfully provides a source of ISP performance data. Check it out for yourself. You can compare your ISP to others in your area, and maybe even improve your service.
But, as I’ve said, there needs to be more data. If content providers have upstream congestion from ISPs like Verizon, data needs to be provided. That way Verizon would be accountable and fix the issue.
For aNewDomain.net, I’m Larry Press.
Based in Los Angeles, Larry Press is a founding senior editor covering tech here ataNewDomain.net. He’s also a professor of information systems at California State University at Dominguez Hills. Check his Google+ profile — he’s at +Larry Press — or email him at Larry@aNewDomain.net.


[…] The old Windows PCs are for the kids, an arcade of fun. The iMac handles email, video Hangouts, Skype, and generic email. None of those systems deal with intensive applications like video editing or rendering, though. (The Hangouts get difficult with Time Warner Cable speeds, but that is another issue altogether.) […]
[…] I’ve talked about ISPs and content providers like Netflix blaming each other over poor Internet performance before. And I believe the public desperately needs transparency around this Netflix Comcast […]