aNewDomain.net — On September 1, 1939, Hitler’s Germany invaded Poland after a ruse now known as the Gleiwitz Incident, a staged SS attack to make it look like Poland had attacked a German radio station. Meanwhile, the entire German army had amassed on the border — including the Danzig corridor — it shared with Poland. Poland never officially surrendered and elements of its army fought on. By war’s end, 5.8 million Poles were dead. That was nearly 17 percent of Poland’s population at the time the invasion began. Scroll below for World War II infographics, animated charts, German and U.S. propaganda videos and more.
German’s invasion of Poland marked the official beginning of World War II, the bloodiest conflict in history, killing more than 60 million souls — 2.5 percent of the total world population at the time. If you count disease and famine related deaths, the war took some 85 million lives. Twenty-five million of the dead were soldiers. And some 20 million European civilians died as a result of Hitler’s genocidal attack on Jews, gypsies and other people he deemed “inferior.” Japan’s war against China and other Asian countries, which began in 1937, claimed another 20 million lives.
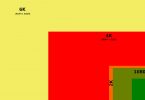
Above interactive World War II infographic: Prezi
After Germany invaded Poland, England and France declared war on Germany. Within two years, most of the world was at war on two fronts — Pacific and European. Every continent including Antarctica was involved. Scroll below the fold for our collection of infographics, videos, charts and animations showing the devastation of World War II and its effect on the world as a whole.
Here is a contemporary news reel describing the war’s beginning. It’s called Germany Invades Poland- France and Britain Declares War …
Video source: DanaOja YouTube Channel
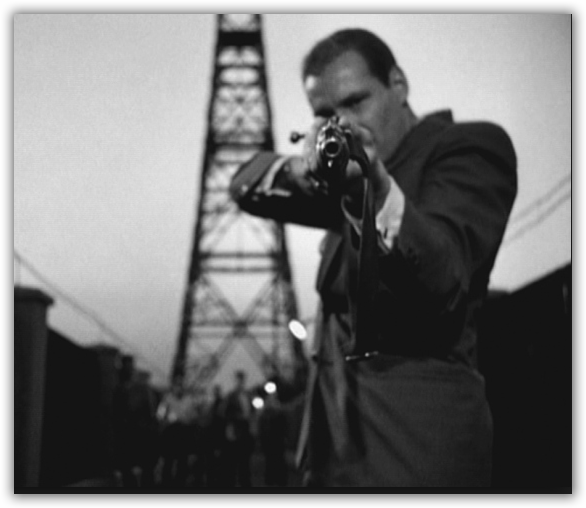
Not surprisingly, the Germans justified their invasion using more than just the Gleiwitz incident. Here is an English-language video produced by the Nazis justifying the invasion. English subtitles are included, this video creator says, so that non-German speakers can understand what Germany was telling its citizens during the war.
Video source: MostCynical YouTube Channel
The World War II infographic, from Visual.ly, shows a so-called bomb census. Click to enlarge.

The U.S. entered the war after Japan — an axis power aligned with Allied enemies Germany and France — attacked Pearl Harbor in Hawaii. This infographic, also from visual.li, explains Pearl Harbor in great detail. Click to enlarge.

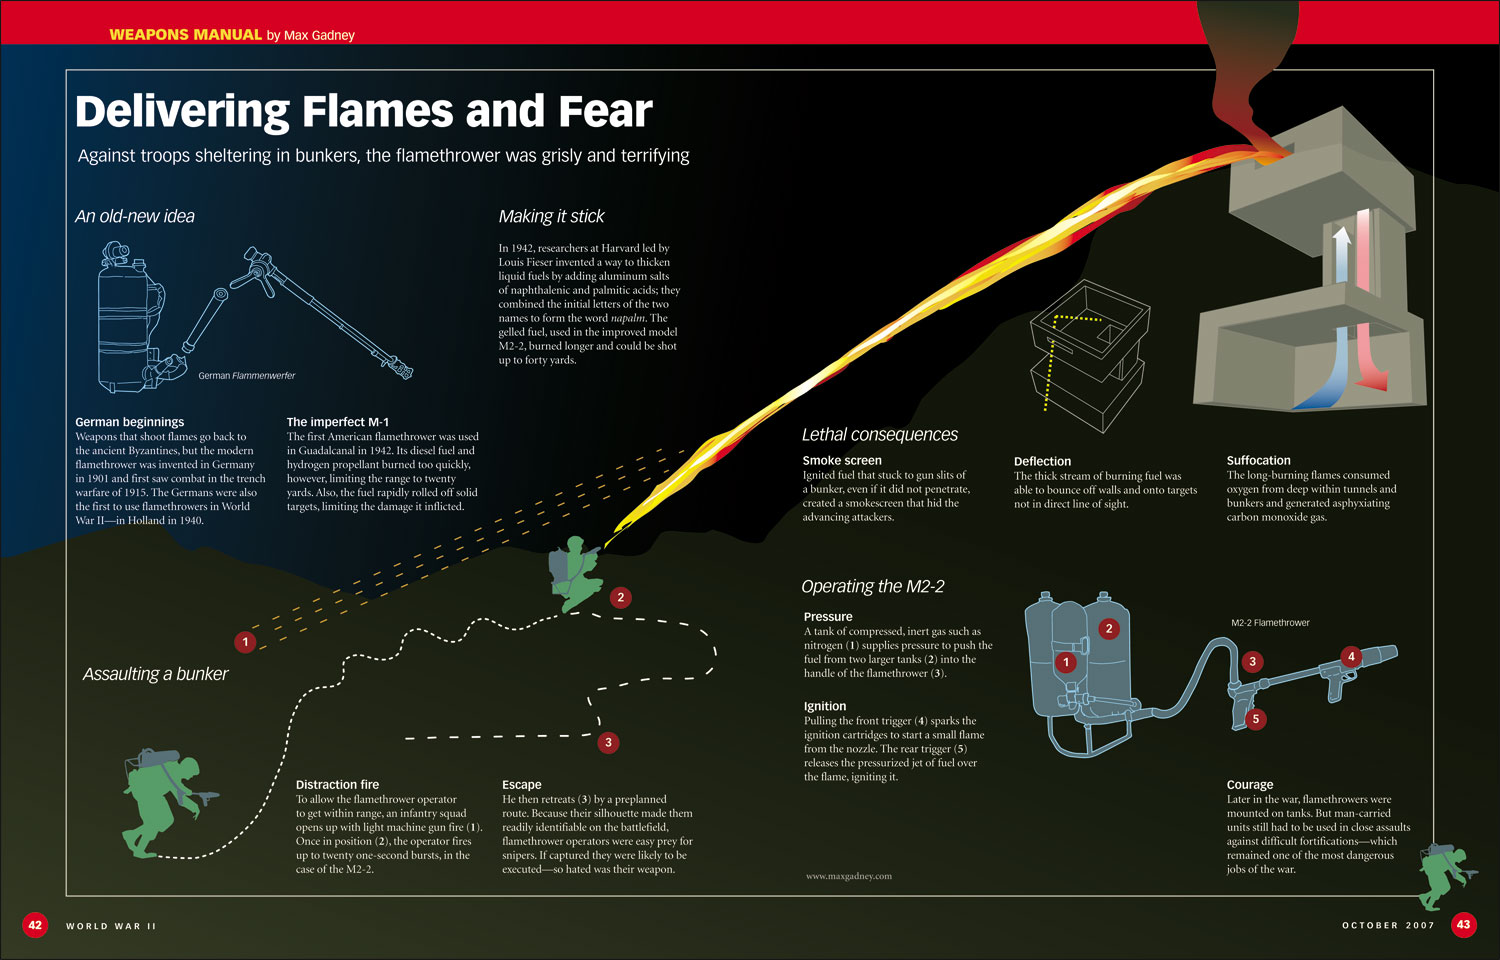
Here’s a World War II infographic on flamegunners. Mind-blowing.

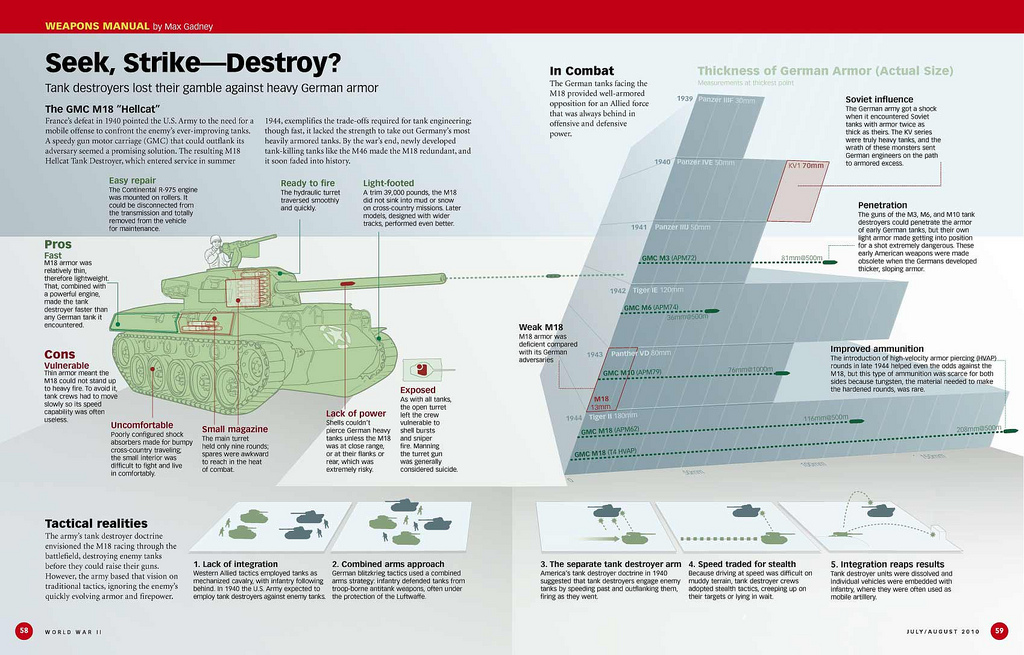
The following World War II infographic comes via MaxGadney‘s World War II Magazine, which has been producing gorgeous World War II infographics for some time now. Below is a World War II infographic describing how and why tank destroyers couldn’t match German armor.
Scroll below that to find other infographics describing weaponry, aircraft, kamikaze fighters, the war’s effect on China and more.
Flamethrowers were widely feared during the conflict. Check out this World War II infographic to see why.
Source: All Graphical Blogspot
Here’s a World War II infographic called China in Numbers — it shows how the end of World II affected modern China. Eye-opening stuff.